
East Sussex College reports 110 students at A or A*, Eastbourne College one in five on straight A*s. Plus the 20 August deadline to challenge a grade.
Two Eastbourne providers have published figures from Thursday’s A-level results, and they are not measuring the same thing. East Sussex College reports that 110 of its students achieved A or A* grades and that 56 of its A-level courses recorded a 100 per cent pass rate, across its Eastbourne, Hastings and Lewes campuses. Eastbourne College says that across a cohort of 117 pupils, grade A was the most frequently awarded grade and one in five pupils took straight A* and A grades.
Neither figure is comparable with the other, and neither is directly comparable with the national statistics. That is worth saying plainly on results day, because the numbers schools choose to publish are the numbers that flatter them, and this year Ofqual’s own data gives you a much better yardstick.
What the two Eastbourne providers reported
East Sussex College is a general further education college, and its Eastbourne campus on Cross Levels Way is the town’s main state-funded route into A-levels. Its published figures are group-wide rather than Eastbourne-only, so read them as a picture of the college across all three campuses. Alongside the 110 students at A or A*, it reports a 91.3 per cent pass rate at T-level with 34 students achieving distinctions, and nine T-level cohorts, including Digital, Health, Management and Administration, and Education and Early Years, at a 100 per cent pass rate. T-levels carry a 315-hour industry placement built into the course.
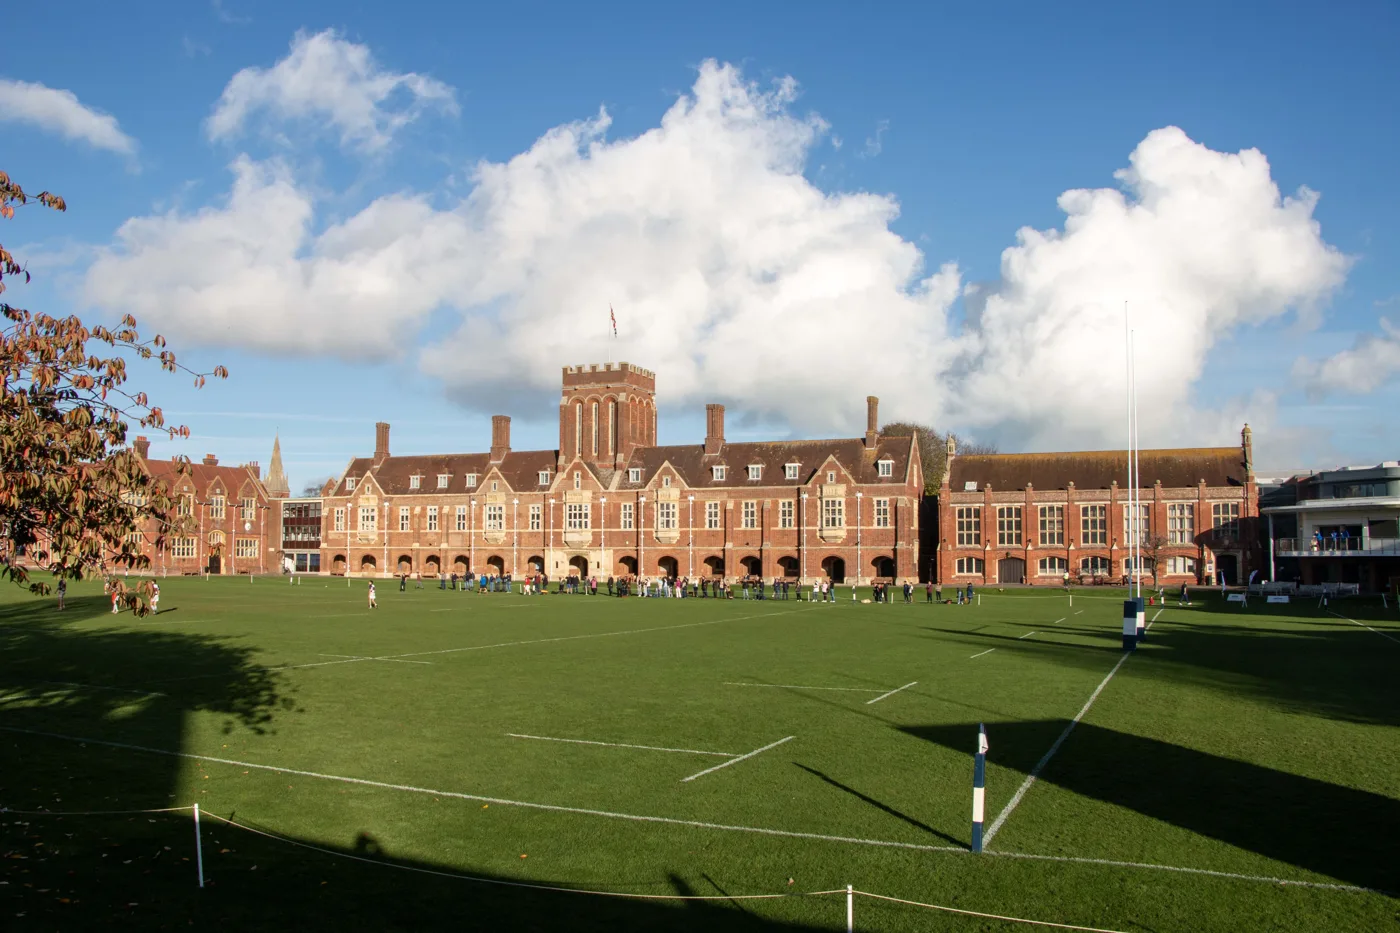
Eastbourne College, the independent school on College Road, published subject-level detail rather than an overall grade share this year. In art, photography and textiles, 86 per cent of grades were A* or A, including 55 per cent at A*. In further mathematics, 69 per cent were A* or A and 92 per cent A* to B. Physics reached 67 per cent A* or A and languages 73 per cent. The school says 85 per cent of leavers secured their chosen university. Its published 2025 figure was 74 per cent of grades at A* to B, a measure it has not repeated for 2026.
Headmaster Tom Lawson said the results were “a testament to the hard work of pupils and the outstanding support of their teachers”, and that the school’s Futures Centre had helped leavers plan next steps.
Gildredge House on Compton Place Road, the only other Eastbourne school with a sixth form, had published no 2026 A-level figures on its website when we checked on 15 August; the most recent exam data on its results page is the 2025 Key Stage 4 set. The borough’s other secondaries, including Ratton, Cavendish, Causeway, Willingdon, St Catherine’s College and The Eastbourne Academy, teach to 16 and do not enter A-level candidates.
The figures that let you judge them
Ofqual published its official statistics at 9.30am on results day. Across England, 835,950 A-level results were issued to 320,505 students, and 28.3 per cent were graded A or above, up marginally on 28.2 per cent in 2025. The South East did better than that: 31.5 per cent of its 166,940 results were A or above, and 79.5 per cent were C or above, the strongest of any English region outside London.
The more useful comparison is by type of centre, because it is the only fair way to read a fee-charging school and an FE college against each other.
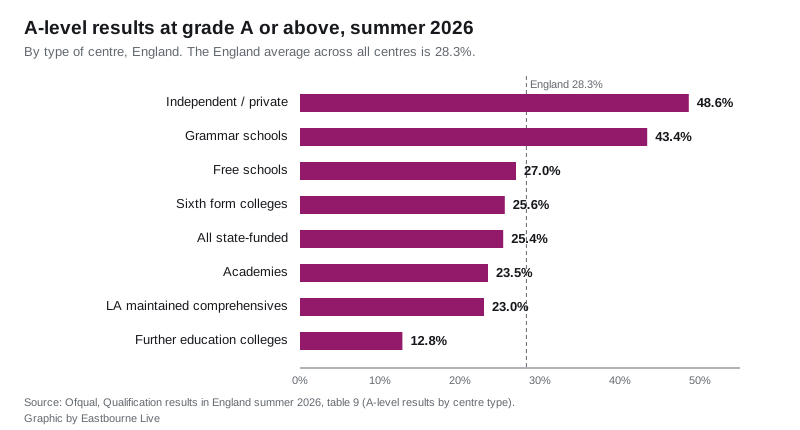
Independent and private schools took 48.6 per cent of their grades at A or above this summer, and 89.4 per cent at C or above. Further education establishments, the category East Sussex College sits in, took 12.8 per cent at A or above and 63.8 per cent at C or above, the lowest of any centre type, and down from 13.7 per cent last year. Sixth form colleges managed 25.6 per cent, and all state-funded centres together 25.4 per cent. The rest of the table runs from grammar schools on 43.4 per cent, through free schools on 27.0 per cent, academies on 23.5 per cent and local authority maintained comprehensives on 23.0 per cent. (Ofqual, table 9, A-level results by centre type)
That gap is not a measure of how well either Eastbourne institution teaches. FE colleges take a very different intake, including students who did not get the GCSE grades for a school sixth form, and they run alongside vocational and technical courses that the A-level tables do not capture at all. The point of the centre-type table is that it stops a comprehensive or a college looking weak next to a national average that is being pulled up by grammar and independent centres.
Why there is no Eastbourne borough figure
You will see local rankings quoted this week, taken from Ofqual’s interactive map of A-level outcomes by administrative area. Treat those with care. Ofqual assigns each result to an area using the postcode of the exam centre from the National Centre Number register, not where the student lives. A district containing a large independent school or a college that draws from a wide catchment therefore ranks on other people’s children. Eastbourne, with an independent school of 117 A-level candidates and a college pulling students from across the coast, is exactly that kind of district.
Nor is there a downloadable borough number. The map runs as an interactive application and its data cannot be extracted without a live session, so the published statistics stop at regional and centre-type level.
Comparing school percentages: read the small print
Schools quote whatever measure suits them, and the labels look similar but are not. Ofqual’s tables report only two things for A-levels: the share of results at A and above, and the share at C and above. A school’s “A*-C” is roughly like for like with “C and above”. Its “A*-B”, the measure Eastbourne College used for 2025, has no national equivalent at all, so it can only be set against that same school’s own previous years. Any figure described as “including equivalents” or “UCAS points equivalent” folds vocational results in and is not an A-level figure.
Nor did either provider publish a full grade distribution, which is what you would need to compare them properly. What each published is a selection, honestly labelled, and that is normal.
What it means for you
If a grade looks wrong, the clock is already running. JCQ’s post-results services set two dates for summer 2026. A priority review of marking, for students whose university place depends on the outcome, must reach the awarding body by 20 August 2026 and is completed within 15 calendar days. It covers AS and A-level and level 3 vocational technical qualifications. Every other review of marking, and a clerical re-check, must be submitted by 24 September 2026, and take up to 20 and 10 calendar days respectively.
Two things families routinely get wrong. The request goes through the school or college’s exams officer, not from you to the exam board directly, and it needs the student’s written consent. And there is no grade protection: a review can lower a grade as well as raise it.
GCSE results follow on Thursday 20 August, the same day as the priority remark deadline. Ofqual updates the same statistical release that morning with the GCSE figures.
If you are still looking for a place, Clearing is open and works on results already achieved rather than predicted grades, through UCAS. East Sussex College’s Eastbourne campus also takes applications after results day for its own level 3 courses.
Local information
- Eastbourne train times to London, for the Victoria service if you are travelling to a university open day or a Clearing visit
- Eastbourne roadworks and travel, for what is closed this week
- Eastbourne planning news and things to do in Eastbourne
Have your say