
August's count is 2,970, or 4.9%. Men are up 90 on the year, women just 5, and July has been revised down to 2,955. Devonshire ward is still on 8.6%.
2,970 people in Eastbourne were claiming unemployment-related benefits in August. That is 4.9 per cent of the borough’s residents aged 16 to 64. It is up 15 on July and up 85 on August last year.
The Office for National Statistics released the figures on 15 September 2026, through Nomis. (ONS claimant count, via Nomis)
July has been revised down, again
When we reported July’s figure in August it was 2,985, and we called it the highest since March. The ONS has since revised July down to 2,955. That is below June’s 2,970, so July was a small fall, not a rise.
This is the second month running that the first figure has been revised down. June went from 2,985 to 2,970 in the same way. Recent months should be read as provisional.
On the revised series, August’s 2,970 matches June. The peak of the past two years is still 2,995, reached in February and March 2026.
Men account for almost all of the year’s rise
Split by sex, the annual increase sits almost entirely with men:
- Men: 1,790, up from 1,700 a year ago, a rise of 90
- Women: 1,185, up from 1,180, a rise of 5
Every figure is rounded to the nearest five, so men and women together make 2,975 rather than the borough’s 2,970.
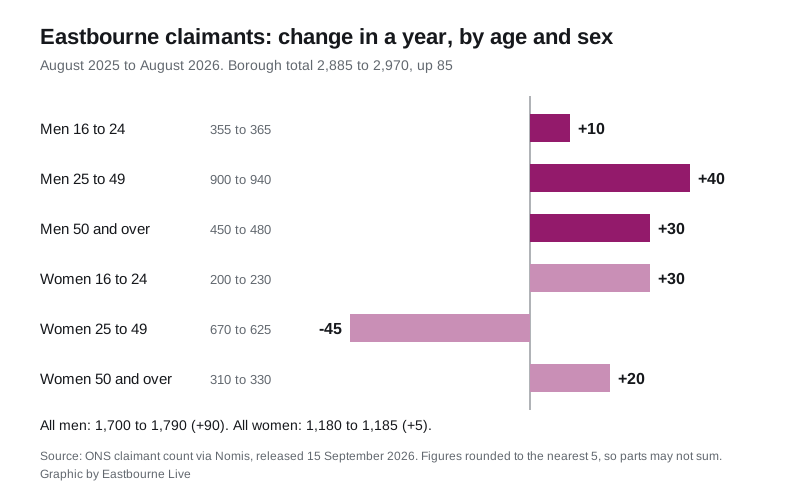
The age bands show where the difference comes from. Women aged 25 to 49 are the only group with fewer claimants than a year ago.
| Group | August 2025 | August 2026 | Change |
|---|---|---|---|
| Men 16 to 24 | 355 | 365 | +10 |
| Men 25 to 49 | 900 | 940 | +40 |
| Men 50 and over | 450 | 480 | +30 |
| Women 16 to 24 | 200 | 230 | +30 |
| Women 25 to 49 | 670 | 625 | -45 |
| Women 50 and over | 310 | 330 | +20 |
For both sexes together, the rise is at the two ends of working life:
- aged 16 to 24: 595, up 40 on the year
- aged 25 to 49: 1,565, down 5
- aged 50 and over: 810, up 50
That is the same pattern we found in July. Under-25s and over-50s together are up 90, more than the whole borough’s rise of 85. (Nomis, claimant count by age and sex, August 2026)
Largest count in East Sussex, but not the fastest rise
Eastbourne still has more claimants than any other district in the county. Hastings has a slightly higher rate.
| District | August 2026 | Rate | Change on August 2025 |
|---|---|---|---|
| Eastbourne | 2,970 | 4.9% | +85 (+2.9%) |
| Hastings | 2,790 | 5.0% | +170 (+6.5%) |
| Wealden | 2,275 | 2.4% | +225 (+11.0%) |
| Lewes | 2,015 | 3.5% | +30 (+1.5%) |
| Rother | 1,650 | 3.2% | +100 (+6.5%) |
Across the wider areas, the picture is:
- East Sussex: 11,695, a rate of 3.7 per cent, up 605 or 5.5 per cent in a year
- South East: 185,290, a rate of 3.1 per cent, up 3.7 per cent
- Great Britain: 1,664,295, a rate of 3.9 per cent, up 2.3 per cent
So Eastbourne’s rate is above all three, but its count is growing more slowly than the county’s. Only Lewes rose more slowly in East Sussex. Wealden’s count grew by 11 per cent, off a much lower rate. (Nomis, claimant count by local authority, August 2026)
Devonshire ward is still four times Ratton
The nine wards add up to exactly 2,970. Devonshire, which covers the town centre, holds 915 of them.
| Ward | Claimants | Rate | Change on July |
|---|---|---|---|
| Devonshire | 915 | 8.6% | +5 |
| Meads | 325 | 5.3% | -10 |
| Hampden Park | 325 | 4.9% | -5 |
| Langney | 305 | 4.8% | no change |
| Upperton | 315 | 4.7% | -5 |
| St Anthony’s | 275 | 4.0% | +5 |
| Old Town | 205 | 3.1% | +10 |
| Sovereign | 195 | 3.1% | no change |
| Ratton | 110 | 2.2% | +10 |
The monthly changes are against July’s revised ward figures. Devonshire’s July number was revised from 930 to 910, so the ward is up 5, not down 15. Devonshire’s 8.6 per cent is almost four times Ratton’s 2.2 per cent. (Nomis, claimant count by ward, August 2026)
What the claimant count measures
The ONS says the claimant count “does not attempt to measure unemployment”. It counts “the number of people claiming benefits principally for the reason of being unemployed, based on administrative data from the benefits system”. (ONS quality and methodology information)
In practice that means Jobseeker’s Allowance plus Universal Credit claimants who must look for work. Some of them are in work on low earnings. It is still the only jobs measure published every month down to ward level.
What it means for you
If you have lost work or had your hours cut:
- Universal Credit is the main route into support and is claimed online
- New Style Jobseeker’s Allowance depends on your National Insurance record and can be claimed alongside Universal Credit
- Council Tax Reduction cuts the bill itself; our Eastbourne council tax bands page has this year’s charges
The September figures are due from the ONS on 20 October 2026. Our business directory lists local firms across the borough by trade.
Sources
- Claimant count, Nomis, ONS, August 2026 release of 15 September 2026: borough, ward, age and sex, East Sussex districts, South East and Great Britain figures, and the revised July and June series. Pulled 16 September 2026.
- Claimant count QMI, ONS: what the measure does and does not count.
Have your say