
2,985 people in Eastbourne claimed unemployment-related benefits in June, 4.9% of working-age residents; Devonshire ward's 8.7% is the borough's highest rate.
2,985 people in Eastbourne were claiming unemployment-related benefits in June, 4.9 per cent of the borough’s residents aged 16 to 64, according to the Office for National Statistics claimant count. That is a full point above the national picture: the rate across Great Britain is 3.9 per cent, across the South East 3.1 per cent and across East Sussex 3.7 per cent, which makes Eastbourne the harder end of its own county’s jobs market. (ONS claimant count, published via Nomis, retrieved 12 August 2026)
The claimant count records people claiming Jobseeker’s Allowance plus those on Universal Credit who are required to look for work. It is not the full unemployment measure, but it is the only jobs figure published every month for small areas, which makes it the best regular signal of how the local labour market is moving. Every figure is rounded to the nearest five. A year ago, in June 2025, Eastbourne’s count stood at 2,880, so it has risen by roughly 105 over twelve months, drifting from 4.7 per cent to 4.9. The recent peak was 2,995 in February and March; May’s figure was 2,930, so June’s 2,985 is a rise of about 55 on the month.
Ward by ward: Devonshire carries almost a third of the count
The ward figures show how unevenly that total falls across town. Devonshire ward, the central town ward, has 920 claimants, 8.7 per cent of its working-age residents, roughly one in eleven. That is nearly a third of the borough’s entire count in one ward, and more than four times the rate in Ratton, where 100 claimants make 2.0 per cent. (Nomis, claimant count by ward, June 2026)
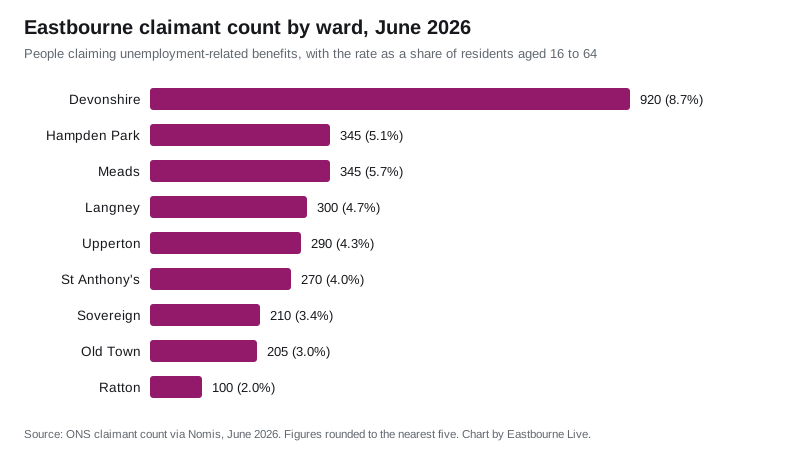
Between those extremes, Hampden Park and Meads each have 345 claimants, though on different rates: 5.1 per cent in Hampden Park and 5.7 per cent in Meads, the borough’s second highest. Langney has 300 claimants (4.7 per cent), Upperton 290 (4.3 per cent), St Anthony’s 270 (4.0 per cent), Sovereign 210 (3.4 per cent) and Old Town 205 (3.0 per cent). Only Ratton, at 2.0 per cent, sits below every regional comparator. The nine published ward figures add up exactly to the borough’s 2,985.
Who is claiming
The age breakdown shows the rise of the past year spread across every group rather than concentrating in one. Claimants aged 16 to 24 went from 530 in June 2025 to 575 this June, those aged 25 to 49 from 1,605 to 1,630, and the over-50s from 750 to 780. Men outnumber women on the count by 1,785 to 1,195, six claimants in ten. (Nomis, claimant count by age and sex, June 2026)
What it means for you
If you are job hunting in Eastbourne, the numbers say the squeeze is real but localised: the borough’s 4.9 per cent rate conceals a central ward running at 8.7 and a suburban north running near 2. The July figures are due from the ONS later this month; we will report them when they appear on Nomis.
If you have lost work or your hours have been cut, the main route into support is Universal Credit, claimed online, and low-income households can also apply for Council Tax Reduction, which cuts the bill rather than paying cash. A steady jobs market also underpins what homes sell for; our Eastbourne house prices page tracks what properties across the borough actually fetch.
Have your say