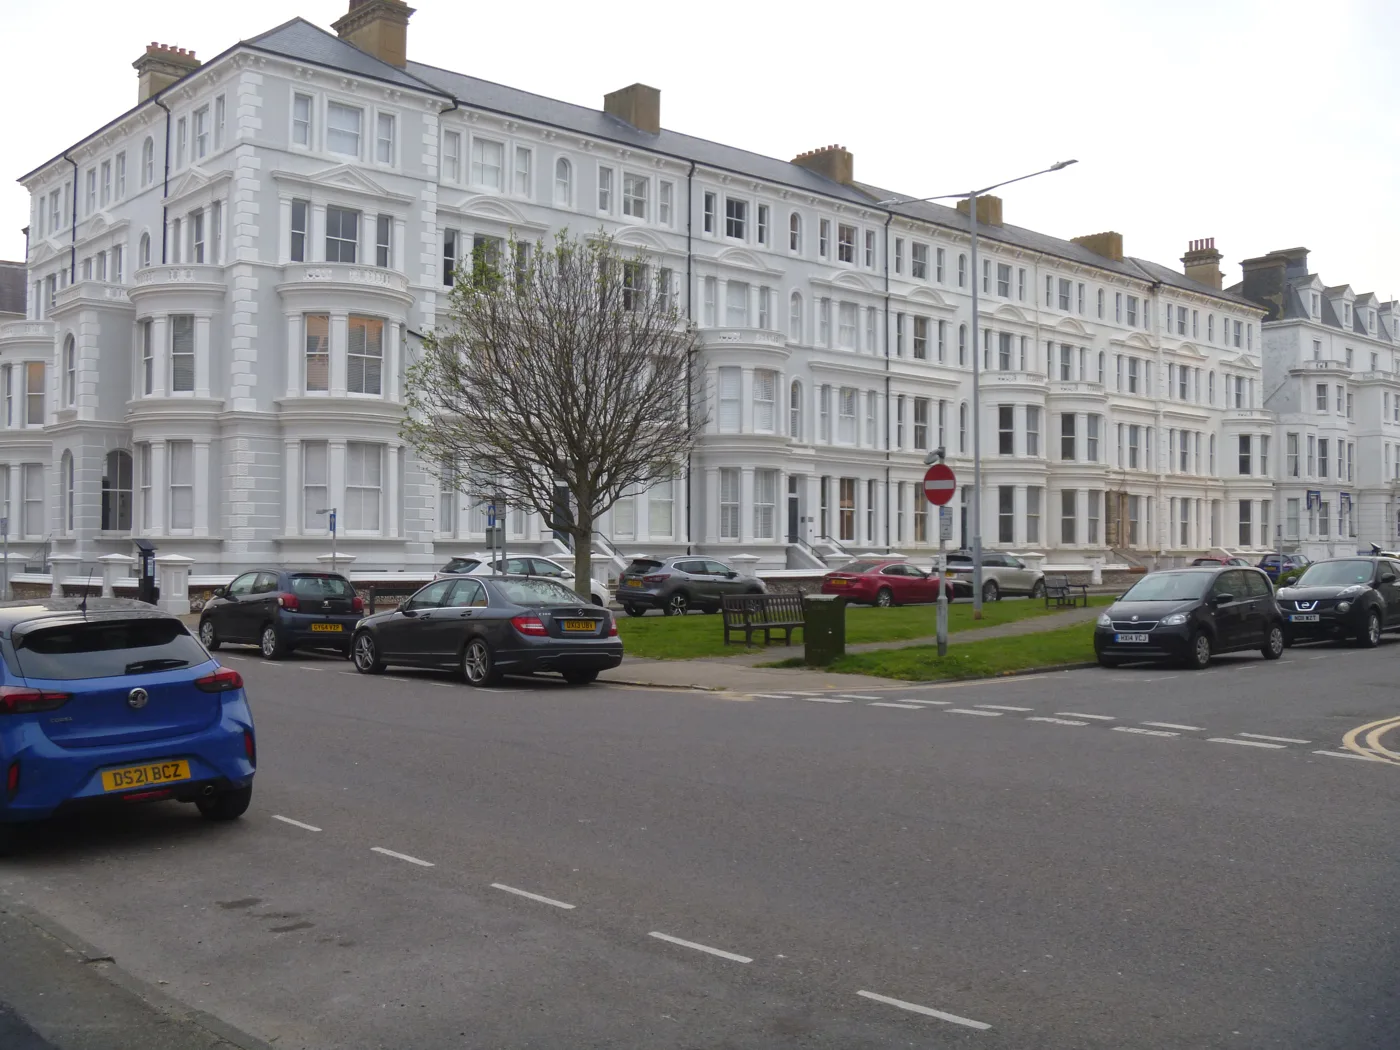

The average Eastbourne home sold for £251,811 in June, down 3.7% on the year. Only Hastings fell faster in East Sussex, and the neighbours are ranked below.
The average home in Eastbourne borough sold for £251,811 in June 2026. That is £9,629 less than a year earlier, a fall of 3.7 per cent.
The figure comes from the June UK House Price Index, published by the Office for National Statistics and HM Land Registry at 9.30am today. It is built from completed sales, not asking prices, so it lags the market by a couple of months but records what people actually paid.
Two things stand out in it. Eastbourne’s fall is the second steepest of the five East Sussex districts, behind only Hastings. And while the borough is down over the year, it went up 0.1 per cent on the month, the only one of the five to do so.
How the East Sussex districts compare
| Area | Average price | Change on the year | Change on the month |
|---|---|---|---|
| Rother | £343,870 | +2.4% | -0.4% |
| Lewes | £367,918 | +1.7% | -0.5% |
| Wealden | £386,787 | -0.7% | -0.5% |
| East Sussex, all | £315,739 | -0.9% | -0.4% |
| Eastbourne | £251,811 | -3.7% | +0.1% |
| Hastings | £236,966 | -4.6% | -0.6% |
For wider context, the South East as a whole rose 0.3 per cent over the year to an average of £380,380, and England rose 1.8 per cent to £293,262. So the East Sussex coast is moving against the national direction, and Eastbourne more than most.
Flats are doing most of the damage
Break the borough figure down by property type and one category stands out.
| Property type | Average price | Change on the year |
|---|---|---|
| Detached | £511,310 | -3.6% |
| Semi-detached | £350,177 | -2.1% |
| Terraced | £278,918 | -2.2% |
| Flat or maisonette | £173,644 | -5.3% |
| First-time buyer | £215,143 | -3.5% |
Flats fell 5.3 per cent, well ahead of any house type. At £173,644 they are also the cheapest thing you can buy in the borough, and the only category more than 5 per cent down on the year. Because the borough average is a single mean across every sale, a weak flat market pulls the headline figure down even in a month when houses hold.
The gap between Eastbourne and its rural neighbours is now wide. The Wealden average is £134,976 higher than Eastbourne’s, and the South East average is £128,569 higher. Only Hastings, at £236,966, is cheaper in East Sussex.
Read the number with care
Three caveats belong with any UK House Price Index figure, and they are not small print.
- It is a mean, not a median. A handful of large sales pulls the average up, so the “average price” is not the price of a typical home.
- It revises. Eastbourne’s May figure was published in July as £250,523, a fall of 3.8 per cent. In today’s release the same month reads £251,538, a fall of 3.5 per cent. That is a £1,015 correction to an already-published number.
- Volumes lag. The index has not yet published sales counts for May or June. The most recent count is April, at 78 completed sales, and the Land Registry warns that recent months are incomplete and revise upwards. Eastbourne records only a few dozen to around 150 sales a month, so a single month is a wobble rather than a trend.
What it means for you
If you are selling, the borough-wide figure is not your figure. A flat is in a weaker market than a house, and the year-on-year fall says more about the mix of what sold than about your street. Price against recent completed sales nearby, not against the headline.
If you are buying, Eastbourne is now £128,569 below the South East average, and first-time buyer stock is averaging £215,143. A year ago that gap was £117,822, so it has widened by close to £11,000 in twelve months. It is the practical reason people keep moving here from Brighton and further west.
If you are staying put, the number that actually reaches you is council tax banding, which is set on 1991 values and does not move with this index at all.
We keep a fuller breakdown, including how the borough compares over a longer run, on our Eastbourne house prices page. What is being built, and where the borough plans to put its housing target, is on Eastbourne planning.
Sources
- UK House Price Index for June 2026, published 19 August 2026.
- Land Registry UK HPI open data, Eastbourne, June 2026 for the borough average, the change by property type and the first-time buyer figure.
- Equivalent June 2026 records for Hastings, Lewes, Rother, Wealden, East Sussex, the South East and England for the comparison table.
- Land Registry UK HPI open data, Eastbourne, May 2026 for the revised May figure, and April 2026 for the most recent published sales count.
- Land Registry UK HPI open data, Eastbourne, June 2025 and the South East, June 2025 for the year-earlier comparison and the widening gap.
Have your say