
July's count rose for a second month to 2,985, 4.9% of working-age residents. Devonshire ward is on 8.8%, yet Eastbourne's annual rise is East Sussex's mildest.
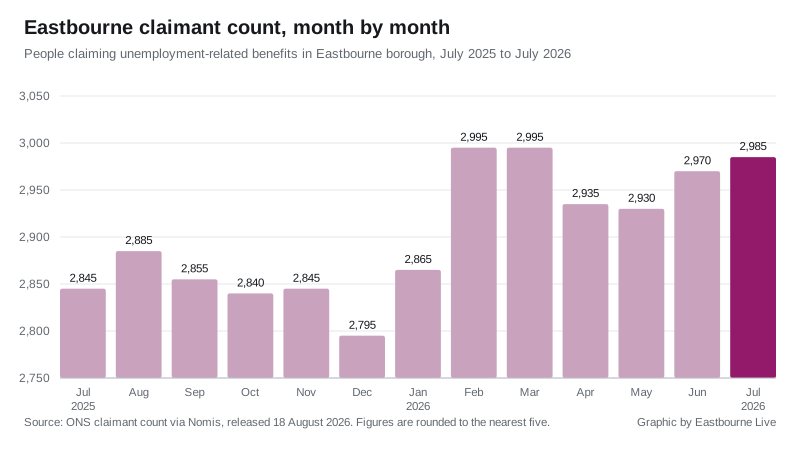
2,985 people in Eastbourne were claiming unemployment-related benefits in July. That is the highest figure the borough has recorded since March, and the second monthly rise in a row.
The number is 4.9 per cent of Eastbourne’s residents aged 16 to 64. It was released by the Office for National Statistics on 18 August 2026 and published through Nomis. (ONS claimant count, via Nomis)
One caveat first, because it changes the shape of the month. When we reported the June figure on 12 August it stood at 2,985. The ONS has since revised June down to 2,970. So July is a rise of 15 on the month, not a flat repeat.
Above every comparator, but rising slower than the county
Eastbourne’s 4.9 per cent rate sits above every wider area it can be measured against:
- Great Britain: 3.9 per cent, 1,657,580 claimants
- South East: 3.1 per cent, 185,120 claimants
- East Sussex: 3.7 per cent, 11,745 claimants
- Eastbourne: 4.9 per cent, 2,985 claimants
The annual picture is the more surprising one. Eastbourne’s count is up 140 on July last year, a rise of 4.9 per cent. Every other district in East Sussex rose faster.
| District | July 2026 | Rate | Change on July 2025 |
|---|---|---|---|
| Eastbourne | 2,985 | 4.9% | +140 (+4.9%) |
| Hastings | 2,815 | 5.0% | +195 (+7.4%) |
| Lewes | 2,055 | 3.5% | +110 (+5.7%) |
| Rother | 1,620 | 3.2% | +85 (+5.5%) |
| Wealden | 2,270 | 2.4% | +200 (+9.7%) |
Wealden’s rise is close to double Eastbourne’s, off a much lower base. Across East Sussex as a whole the count is up 6.7 per cent in a year. Across Great Britain it is up 1.6 per cent. So the county is deteriorating around four times faster than the country, and Eastbourne is the least bad of its five districts on that measure while still carrying the largest raw count. (Nomis, claimant count by local authority, July 2026)
Devonshire holds almost a third of the borough’s total
The nine ward figures add up exactly to 2,985, and they are nowhere near evenly spread. Devonshire ward, covering the town centre and the streets behind the seafront, accounts for 930 of them.
| Ward | Claimants | Rate | Change on June |
|---|---|---|---|
| Devonshire | 930 | 8.8% | +5 |
| Meads | 340 | 5.6% | -5 |
| Hampden Park | 335 | 5.0% | -5 |
| Langney | 310 | 4.8% | +15 |
| Upperton | 310 | 4.6% | +10 |
| St Anthony’s | 270 | 4.0% | no change |
| Sovereign | 195 | 3.2% | -5 |
| Old Town | 195 | 2.9% | -5 |
| Ratton | 100 | 2.0% | no change |
Devonshire’s 8.8 per cent is more than four times Ratton’s 2.0 per cent, and it is the only ward in the borough above 6 per cent. Langney had the largest increase on the month, up 15. Four wards fell by five and two did not move. (Nomis, claimant count by ward, July 2026)
The rise is at the two ends of working life
Split by age, the year’s increase has almost entirely missed the middle of the labour market:
- Aged 16 to 24: 585, up from 525 a year ago, a rise of 11.4 per cent
- Aged 25 to 49: 1,595, up from 1,580, a rise of 0.9 per cent
- Aged 50 and over: 805, up from 740, a rise of 8.8 per cent
In other words, the people leaving the count are being replaced by younger and older claimants. Of the 140 extra claims over the year, 125 are accounted for by the under 25s and the over 50s combined. Men outnumber women on the count, 1,790 to 1,200, though rounding means those two do not sum exactly to the borough total. (Nomis, claimant count by age and sex, July 2026)
Eastbourne’s under 25 rise of 11.4 per cent is close to the Great Britain figure of 9.9 per cent, and milder than Hastings on 14.7 per cent or Wealden on 16.2 per cent.
What the claimant count actually measures
It records people claiming Jobseeker’s Allowance plus those on Universal Credit who are required to look for work. It is not the full unemployment rate, and it will include some people who are working but on low enough hours to still be searching. What makes it worth watching is that it is the only jobs figure published every month for areas as small as a ward. Every figure is rounded to the nearest five, and recent months are routinely revised, as June’s was here.
What it means for you
If you are looking for work in Eastbourne, the headline rate of 4.9 per cent hides two very different towns: a centre running at 8.8 per cent and a northern edge at 2.0. Where you live changes the competition for the same jobs.
If your hours have been cut or you have lost work:
- Universal Credit is the main route into support and is claimed online
- Council Tax Reduction cuts the bill itself rather than paying you cash, and is worth checking on a low income
- New Style Jobseeker’s Allowance is based on your National Insurance record and can be claimed alongside Universal Credit
The August figures are due from the ONS in mid September and we will report them when they land. A weakening jobs market also feeds into what homes sell for locally: our Eastbourne house prices page tracks what property across the borough is actually fetching, and our business directory lists local firms across the borough by trade.
Update, 16 September 2026: the ONS has since revised July’s count down from 2,985 to 2,955, below June’s revised 2,970, so July was not the highest since March. Devonshire ward’s July figure was revised from 930 to 910. The August figures and the revised series are in our August claimant count report.
Have your say