
The average Eastbourne home reached £254,636 in July, a £3,999 jump and the sharpest monthly rise in three years. Prices are still 13% below their 2022 peak.
The average home in Eastbourne borough sold for £254,636 in July 2026, up £3,999 on June. In percentage terms that is a rise of 1.6 per cent in a single month, and the index has not recorded a month that strong in Eastbourne since June 2023.
It is not a recovery yet. The same figure is £4,198 lower than in July 2025, and it sits £38,024 below the borough’s August 2022 peak of £292,660, a fall of 13.0 per cent over four years.
The numbers come from the UK House Price Index, published by the Office for National Statistics and HM Land Registry and released on 16 September. It is built from completed sales rather than asking prices, so it records what people actually paid, a couple of months after they paid it. It is a mean average, not a median, so a handful of expensive sales pull it upwards.
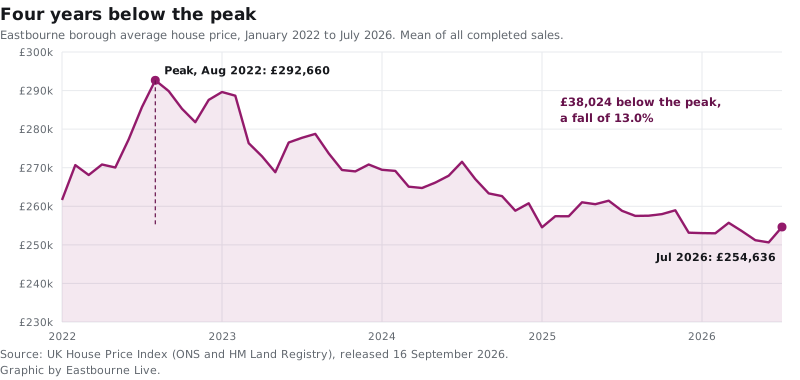
The fall had been getting worse, not better
The month before this one was the worst in two years. June 2026 came in 4.1 per cent down on June 2025, the steepest annual fall Eastbourne had recorded since 2024. July’s figure cuts that to 1.6 per cent.
That is the useful thing in this release. The borough’s annual change has now been negative in 25 of the last 26 months, the one exception being November 2025 when it was flat at zero. A single month at plus 1.6 per cent does not end that, but it is the first sign of the direction changing since the spring.
One caution, and it is a specific one. We reported June’s average as £251,811 in August. The index has since revised it down to £250,637, and revised June’s annual change from minus 3.7 per cent to minus 4.1 per cent. Every month in this index moves as more sales are registered, including the one above.
Flats are carrying the fall
Break the borough average down by property type and the weakness is concentrated in one place.
| Property type | Average price | Change on the year |
|---|---|---|
| Detached | £518,179 | -0.7% |
| Semi-detached | £354,506 | +0.3% |
| Terraced | £282,826 | 0.0% |
| Flat or maisonette | £174,992 | -3.8% |
| All property | £254,636 | -1.6% |
Semi-detached houses are the only type that rose over the year, and only just. Terraced houses are exactly level. Detached houses are down less than one per cent. Flats are down 3.8 per cent, and they are £34,953 below their own August 2022 peak of £209,945, a fall of 16.6 per cent.
That matters more in Eastbourne than it would in most towns, because flats are a large share of what the borough sells. It is also why the all-property average of £254,636 sits below the price of a terraced house at £282,826. If you are reading an “Eastbourne average” anywhere and you own a house rather than a flat, the number that applies to you starts at £282,826 and goes up.
First-time buyers paid an average of £217,644, down 1.5 per cent on the year. Buyers who already owned paid £309,616, down 1.6 per cent.
How Eastbourne compares
Eastbourne remains the second cheapest district in East Sussex, and the gap to the county’s rural districts is large.
| Area | Average price | Change on the year | Change on the month |
|---|---|---|---|
| Brighton and Hove | £408,948 | -1.1% | +0.3% |
| Wealden | £391,211 | -0.8% | +1.6% |
| South East, all | £380,878 | +0.2% | +0.5% |
| Lewes | £368,408 | +0.8% | -0.1% |
| Rother | £337,816 | +0.5% | -2.3% |
| East Sussex, all | £316,959 | -1.0% | +0.6% |
| England, all | £293,479 | +1.1% | +0.7% |
| Eastbourne | £254,636 | -1.6% | +1.6% |
| Hastings | £238,757 | -4.9% | +1.4% |
Three things fall out of that table.
- Eastbourne and Wealden posted the joint biggest monthly rise in the group, both at 1.6 per cent, while Rother fell 2.3 per cent and Lewes edged down.
- Eastbourne is £136,575 cheaper than Wealden, the district immediately to the north and west. Polegate, Hailsham and Willingdon are Wealden, not Eastbourne, so a move of a couple of miles crosses that line.
- England is up 1.1 per cent on the year while Eastbourne is down 1.6 per cent. The borough is not tracking the national picture, and has not been for two years.
What the index does not tell you yet
The index publishes a count of completed sales alongside the price, but on a longer lag, and those counts move. The most recent month with a figure for Eastbourne is May 2026, at 77 sales.
Treat that with care. In August we reported April 2026 as 78 completed sales, taken from the same source; April now stands at 84, because sales keep being registered after the count is first published. The recent monthly counts are therefore incomplete rather than low, and they cannot be compared with 2025’s until they settle.
What it means for you
If you are selling, the July figure is the first encouraging month since the spring, but one month is not a trend and the index still has Eastbourne 13 per cent below where it was four years ago. Price against completed sales in your own street rather than a borough average, and remember that the average is dragged down by flats.
If you own a flat, the numbers are worse than the headline. Flats are down 3.8 per cent on the year and 16.6 per cent since 2022, and they are the only type still falling meaningfully.
If you are buying your first home, £217,644 is the borough’s average first-time buyer price, roughly £76,000 below the England average for all property. What you get for it depends heavily on type: the same money buys a flat comfortably and a terraced house barely.
If you are working out a council tax band, note that bands are set on April 1991 values, not today’s, so none of the figures above change what you pay. Bands and the 2026/27 charge for each one are on Eastbourne council tax bands.
Our standing page on Eastbourne house prices carries the full breakdown by property type and by buyer, and is updated with each monthly release. What is being built, and where, is on Eastbourne planning news, including the draft Local Plan’s 4,400-home housing requirement.
The next release, covering August 2026, is due in mid-October.
Sources
- UK House Price Index, Eastbourne, July 2026 for the average price, the monthly and annual changes, the figures by property type and by buyer, and the first-time buyer average.
- UK House Price Index, Eastbourne, monthly series for the August 2022 peak of £292,660, the June 2026 revision to £250,637, the June 2026 annual change of minus 4.1 per cent, the flat peak of £209,945, and the sales counts for April and May 2026.
- UK House Price Index for Wealden, Lewes, Rother, Hastings, Brighton and Hove, East Sussex, the South East and England, all July 2026.
- Our own June 2026 report, published 19 August 2026, for the figures the index has since revised.
All figures compiled from the UK House Price Index open data on 23 September 2026, under the Open Government Licence. UKHPI averages are means across all completed sales, not medians.
Have your say