
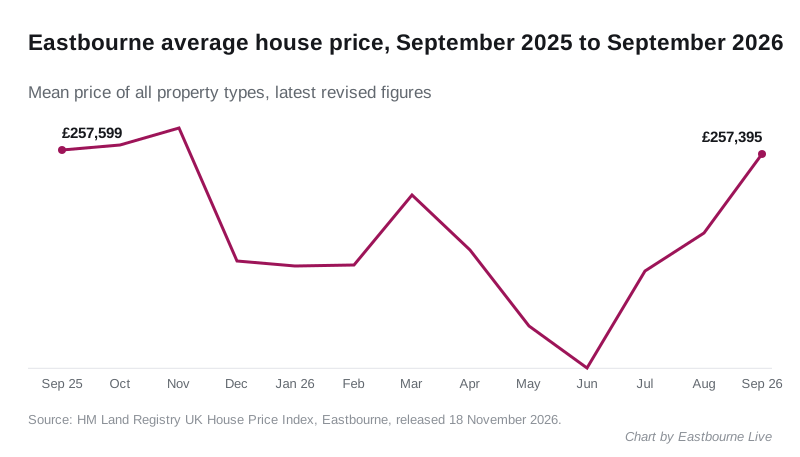
The average Eastbourne home sold for £257,395 in September, up £3,423 on August. Prices are now just 0.1% down on a year ago, the second best figure in East Sussex.
Overview
The average home in Eastbourne borough sold for £257,395 in September 2026. That is £3,423 more than in August, a rise of 1.3 per cent in a month, and the third monthly rise in a row. On the year, prices are down just £204, or 0.1 per cent.
The figures come from the UK House Price Index for Eastbourne, published by HM Land Registry and the ONS on 18 November. The index is a mean average of completed sales, not a median, and not asking prices.
Three months of rises
In June the borough average was £248,064, down 5.1 per cent on the year. Since then it has risen every month:
- July: £252,305
- August: £253,972
- September: £257,395
That is £9,331 added in three months. September’s average is the highest since November 2025, when it was £258,523.
The borough is still well short of its peak. The average reached £292,660 in August 2022. September’s figure is £35,265 lower, a fall of 12.0 per cent. (UKHPI, Eastbourne monthly series)
Eastbourne also moved against the national trend in September. Over the same month the England average fell 0.4 per cent and the South East fell 0.3 per cent.
Earlier months have been revised down
The index revises recent months as more sales are registered, and in Eastbourne the revisions have been downwards.
| Month | First published | Now | Annual change now |
|---|---|---|---|
| June 2026 | £251,811 | £248,064 | -5.1% |
| July 2026 | £254,636 | £252,305 | -2.5% |
We reported July as down 1.6 per cent on the year. On today’s figures it was down 2.5 per cent. September’s figure could be revised in the same way.
The number of sales is also still low. The index records 97 sales in Eastbourne in July 2026, against 119 in July 2025. Sales counts for August and September are not yet published.
Prices by type of home
Every type of house is now worth more than a year ago. Flats are the exception.
| Type | September 2026 | Change on September 2025 |
|---|---|---|
| Detached | £524,307 | +0.9% |
| Semi-detached | £358,301 | +1.7% |
| Terraced | £285,653 | +1.2% |
| Flat or maisonette | £176,865 | -2.0% |
| All property | £257,395 | -0.1% |
Flats pull the borough average below the price of a terraced house. The flat average a year ago was £180,516.
First-time buyers paid an average of £220,211, up 0.2 per cent on the year. Buyers using a mortgage paid 0.3 per cent more than a year earlier; cash buyers paid 0.6 per cent less. (UKHPI, Eastbourne, September 2026)
How Eastbourne compares
Only Lewes did better in East Sussex in September. Every other district fell further.
| Area | September 2026 | Change on the year |
|---|---|---|
| Lewes | £374,607 | +1.2% |
| Eastbourne | £257,395 | -0.1% |
| Wealden | £383,520 | -2.2% |
| Hastings | £235,346 | -3.0% |
| Rother | £333,805 | -3.2% |
| East Sussex | £315,286 | -1.5% |
| Brighton and Hove | £412,316 | -1.1% |
| South East | £378,915 | -0.2% |
| England | £292,998 | +0.8% |
Eastbourne is still the second cheapest district in the county. Only Hastings, about 15 miles east, is cheaper. The Eastbourne average is £35,603 below England’s. (UKHPI for Lewes, Wealden, Hastings, Rother, East Sussex, Brighton and Hove, South East and England, September 2026)
What it means for you
If you are selling a house, detached, semi-detached and terraced homes are all now worth more than a year ago. The rise is small, between 0.9 and 1.7 per cent.
If you are selling a flat, the average is still 2.0 per cent down on the year, and £3,651 lower than in September 2025.
If you are buying your first home, the first-time buyer average of £220,211 is almost exactly where it was a year ago. Three months of rises suggest the cheapest point may have passed, though the June and July revisions show how much these figures can still move.
The October figures are due on 16 December.
Sources
- UK House Price Index, Eastbourne, September 2026: average price, monthly and annual change, prices by property type, first-time buyer, cash and mortgage figures.
- UK House Price Index, Eastbourne, monthly series: the revised June, July and August figures, the November 2025 figure, the August 2022 peak of £292,660, and July sales counts. Pulled 18 November 2026.
- UK House Price Index for the East Sussex districts, Brighton and Hove, East Sussex, the South East and England, September 2026, linked above.
- First-published June and July figures: our own reports of June and July.
Have your say